Welcome!
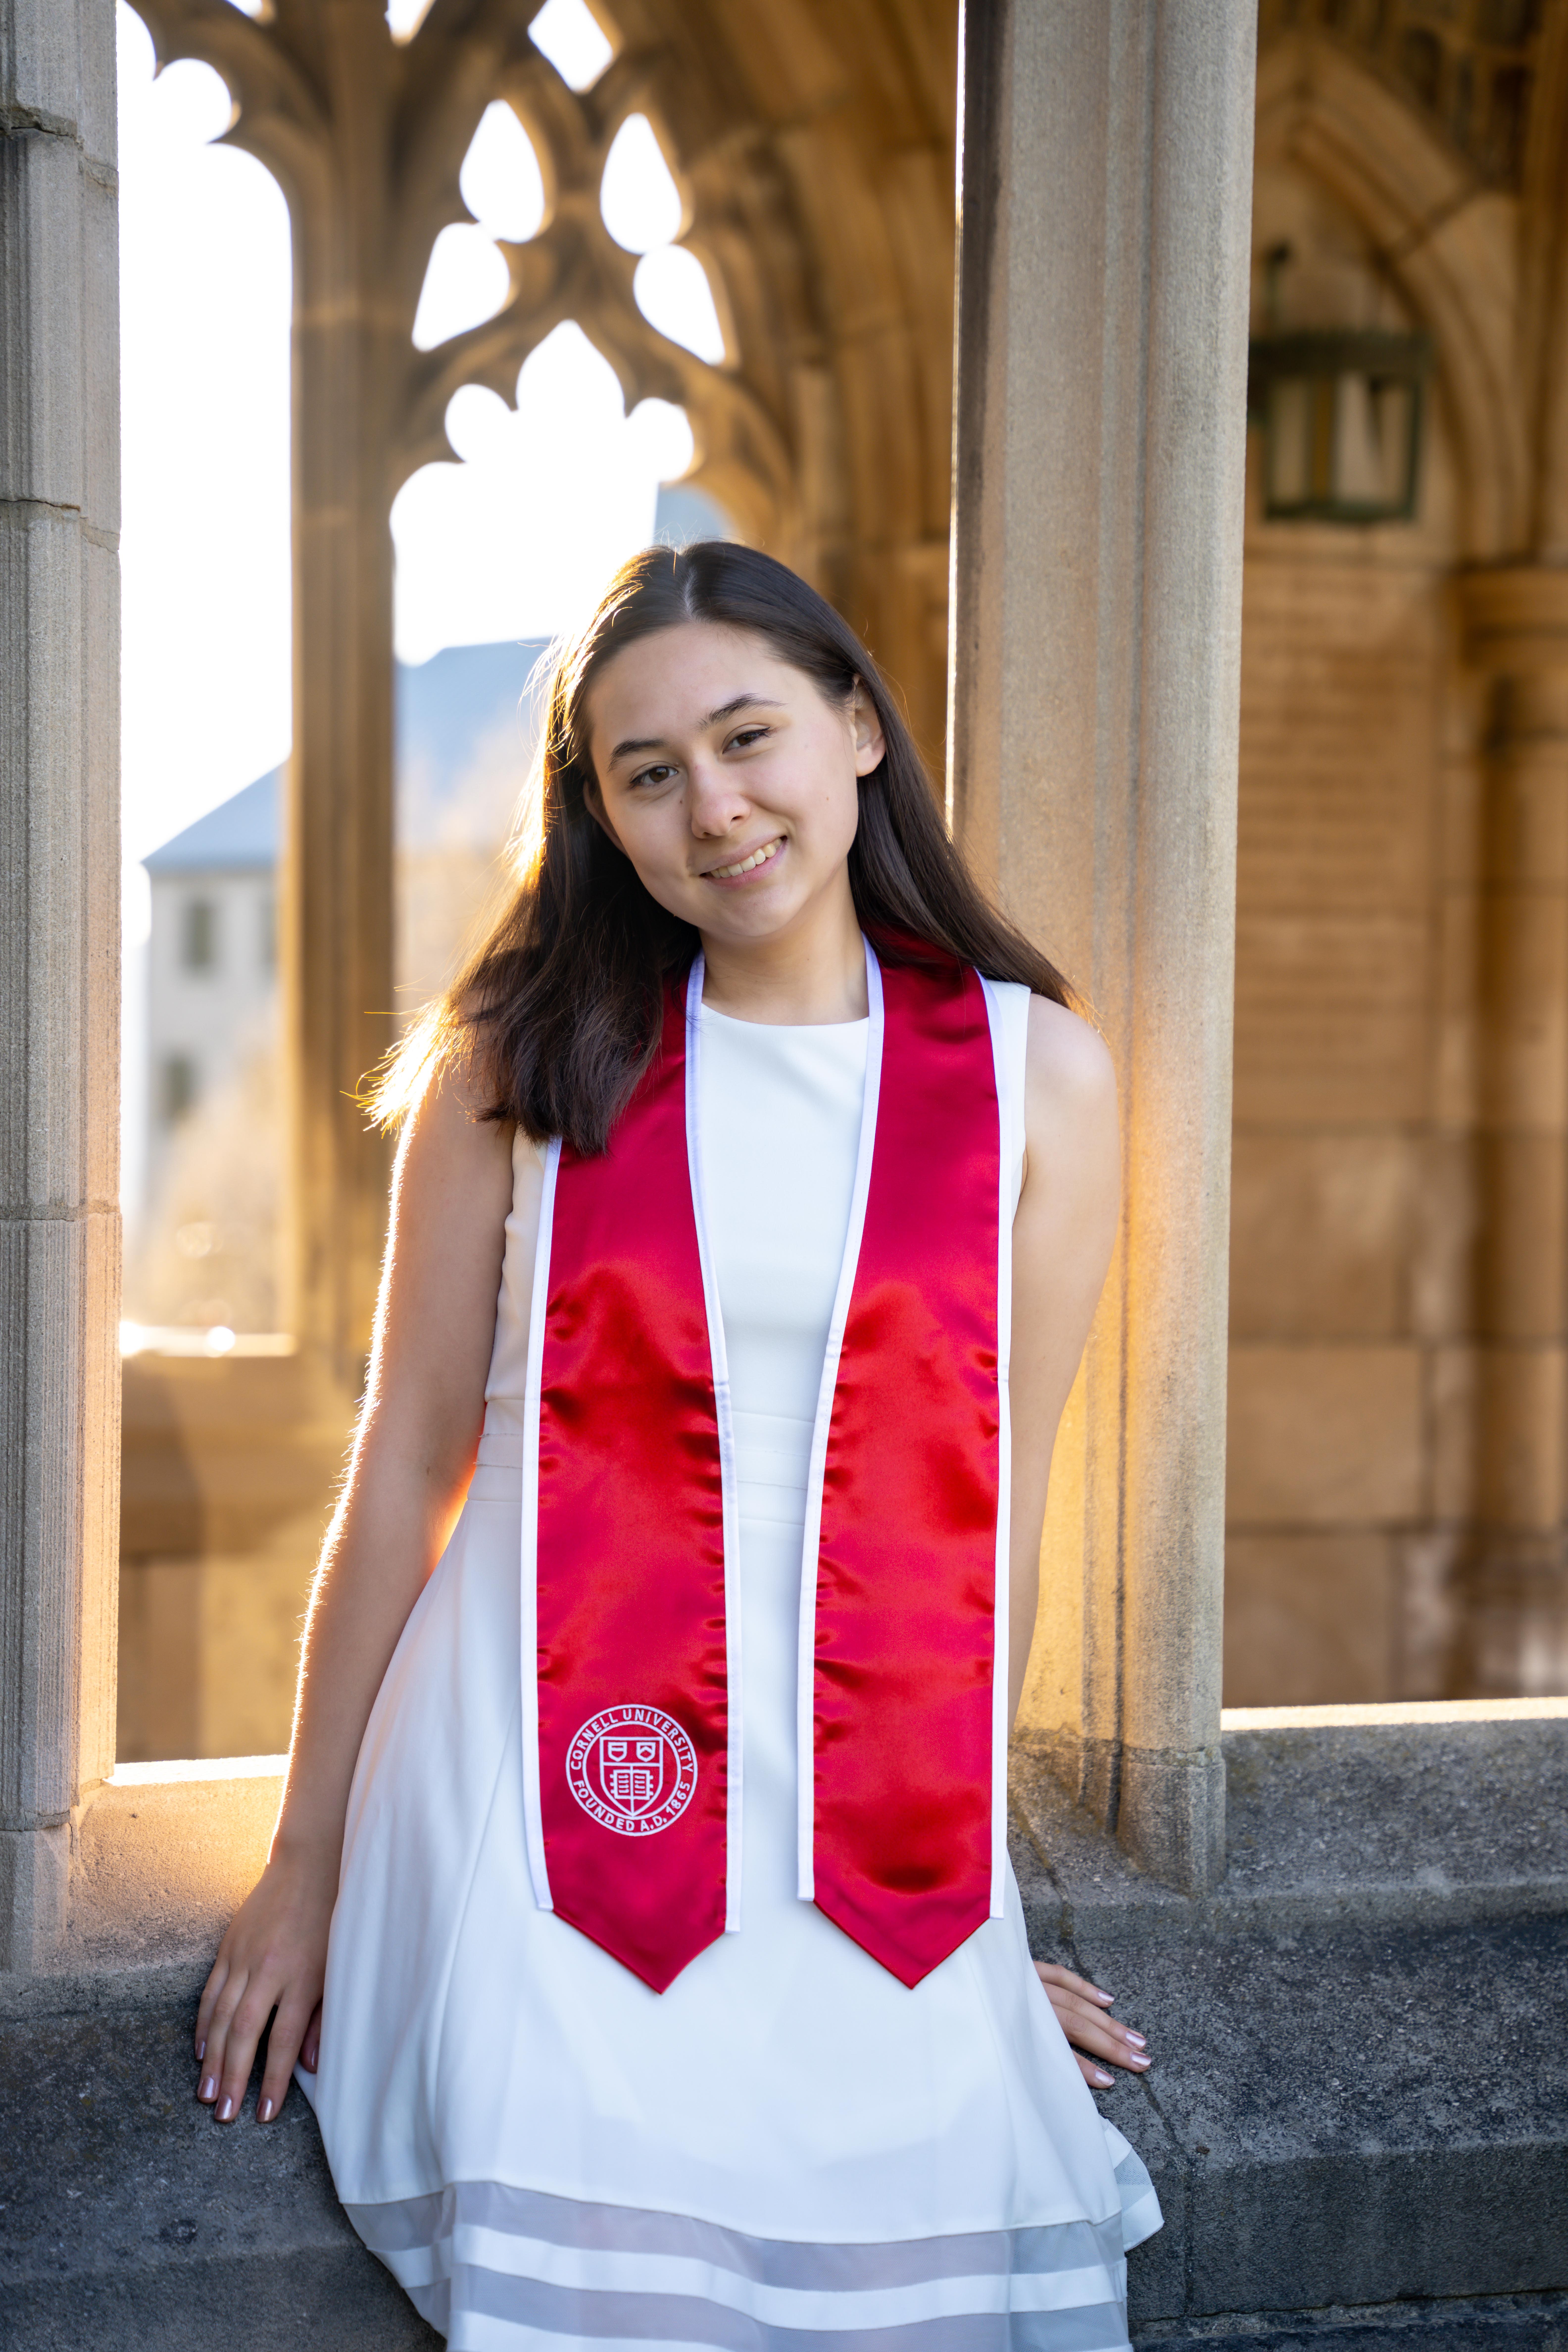
I'm Mary Kolbas, a Cornell University graduate that majored in Information Science and minored in Operations Research.
I currently work at Capital One, overseeing both ongoing and innovative, early-stage customer experience intents with growing strategic value. I regularly execute and optimize operational and marketing campaigns and conduct exploratory analysis to make business intent recommendations that priortize flexiblity for customers while accounting for risk.
I'm always excited to chat about UX design, game theory, and data visualization.
I'm a proud alumni of the Milstein Program in Technology and Humanity, Project Hope at Cornell, and Cornell Lion Dance!
Experience
These are just a few highlights! See a full list of experience.

Business Analyst (Associate)
I regularly conduct exploratory analysis to make business intent recommendations that prioritize flexibility for customers while accounting for risk. I influenced senior leadership and partners across the company to launch feature awareness marketing campaigns for new and growing customer experience focused intents.
Business Analyst Intern
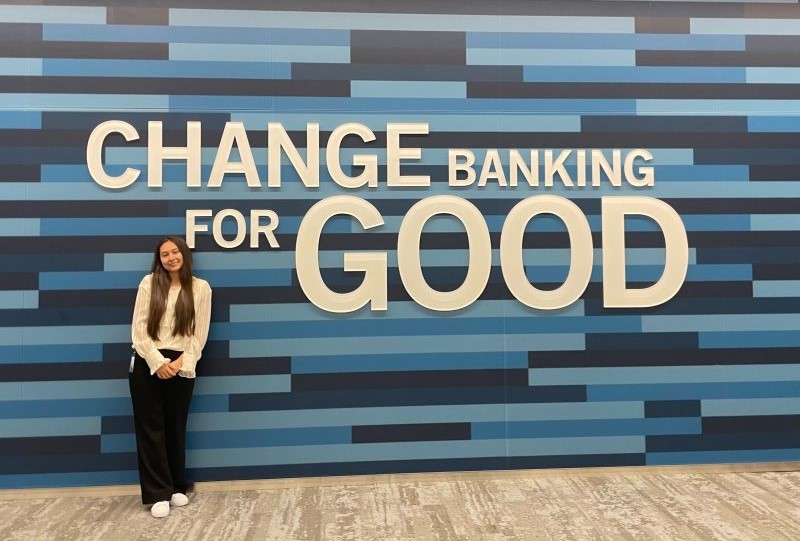
I performed data analysis on Small Business Card (SBC) transaction decline data to improve customer-level underwriting in future policy adjustments and reduce charge-off risk using SQL and Snowflake. I also gained storytelling skills, creating several presentations for upper-level SBC management.

INFO 2040 (Networks) and INFO 2770 (Computational Sustainability) Teaching Assistant
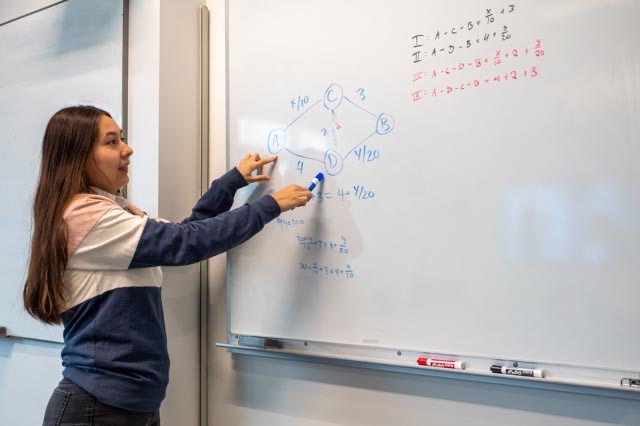
INFO 2040 (Networks): I hosted weekly office hours and answer forum questions online to support a class of over 500 students, primarily focusing on graph theory and game theory concepts. I was also responsible for grading assignments with quick turnover and feedback.
INFO 2770 (Computational Sustainability): I hosted biweekly office hours for an interdisciplinary and diverse class for computer science, business, and environmental science students. Class content is focused on technology used in sustainability efforts, including beginner computing and search concepts, networks, and linear programming.
Projects
These are just a few highlighted projects! See my full portfolio of projects.
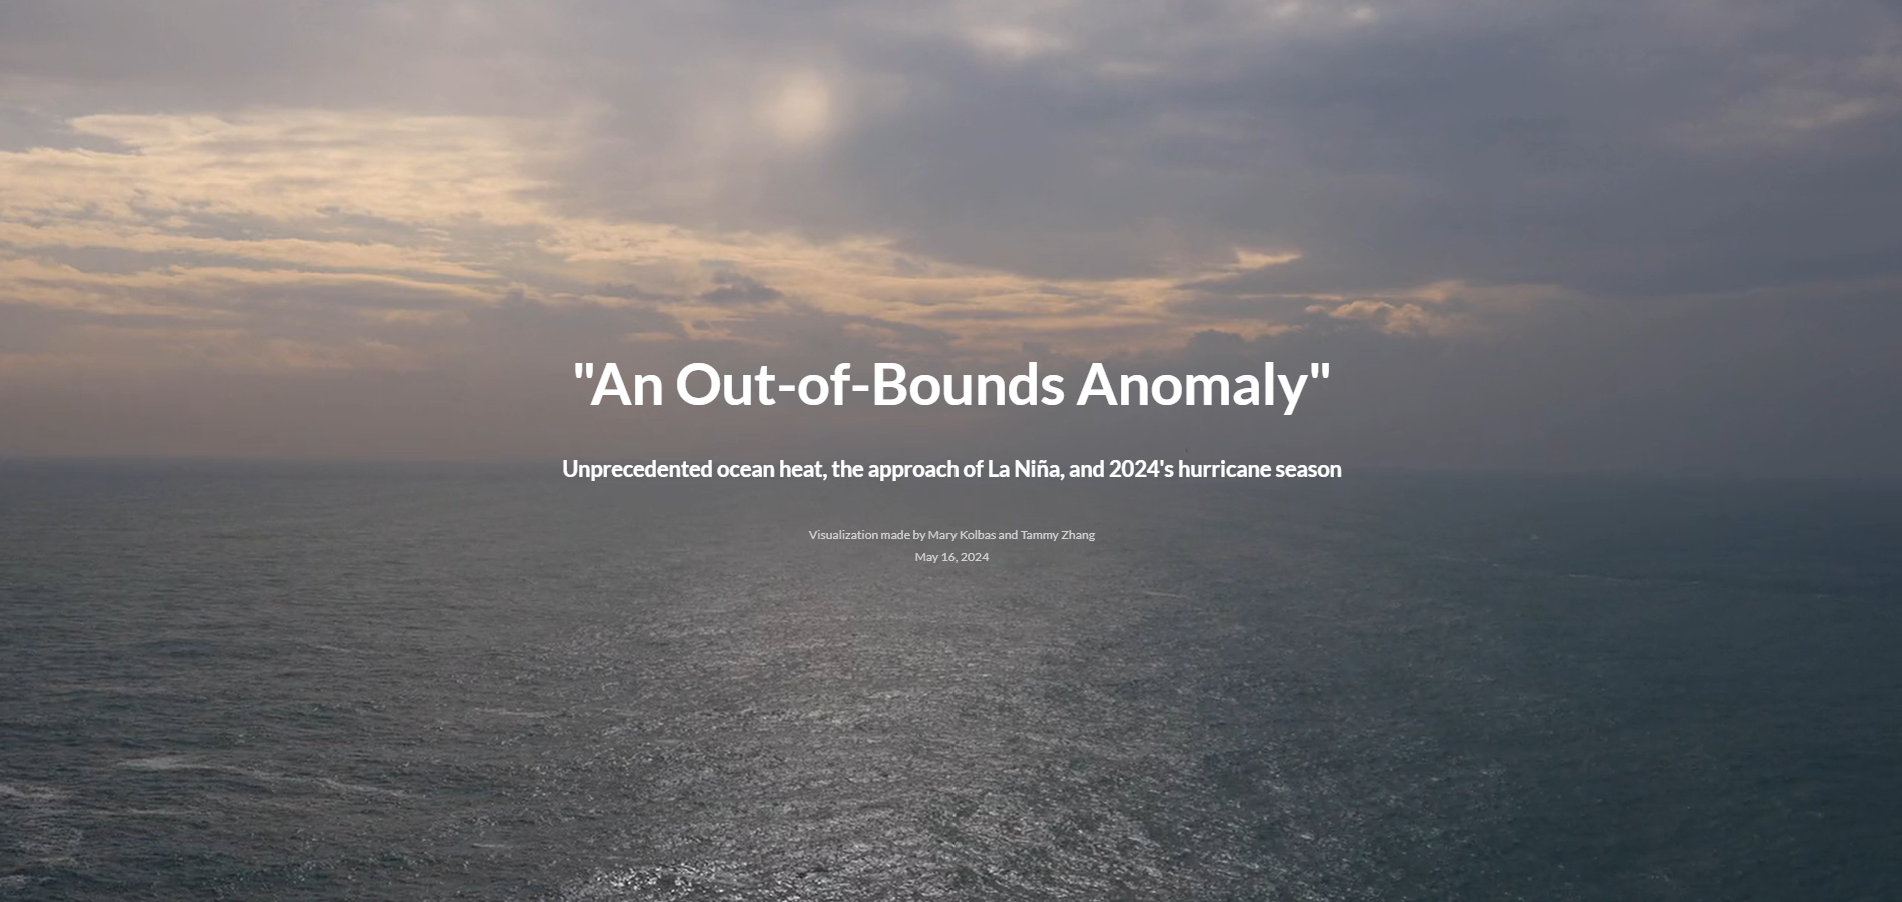
"An Out-of-Bounds Anomaly" - 2024 Hurricane Season Visualization
For our final project, my partner and I created a interactive scrollytelling article to inform readers about unprecedented rising ocean temperatures and the effects of La Niña on the 2024 hurricane season.
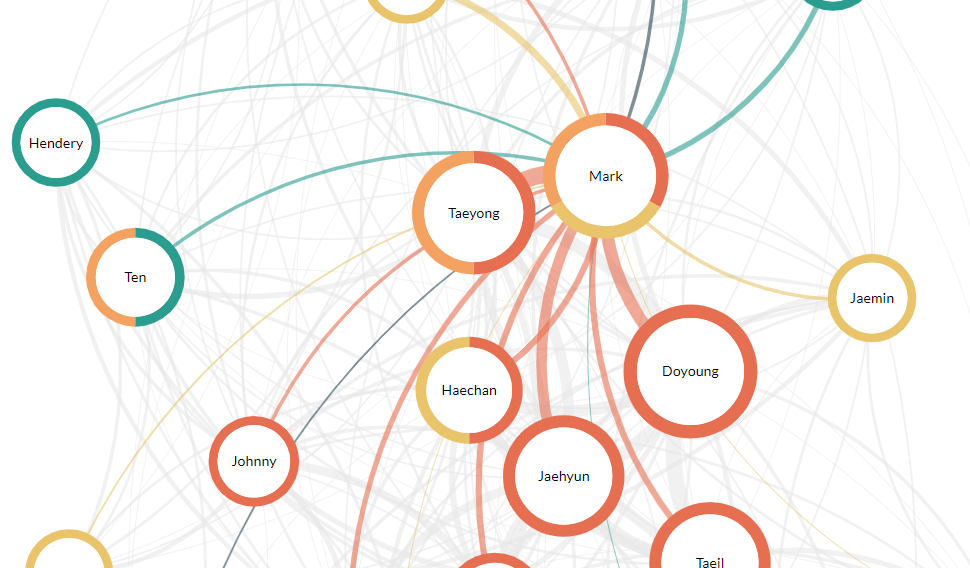
NCT Force: A visualization of K-Pop Group NCT's Discography Network
Combining my interests in networks, data visualization, and K-pop, my partner and I created a interactive force diagram data visualization of NCT's 23 members and which songs members have been on together using d3.js. Pan, zoom, hover, and click interactions allow users to explore relationships between members and expand for more information on demand.
This project is a design critique of a personal project from January 2023, NCT Chord.
NCT Force is not currently fit for mobile viewing. Please view on a larger screen.
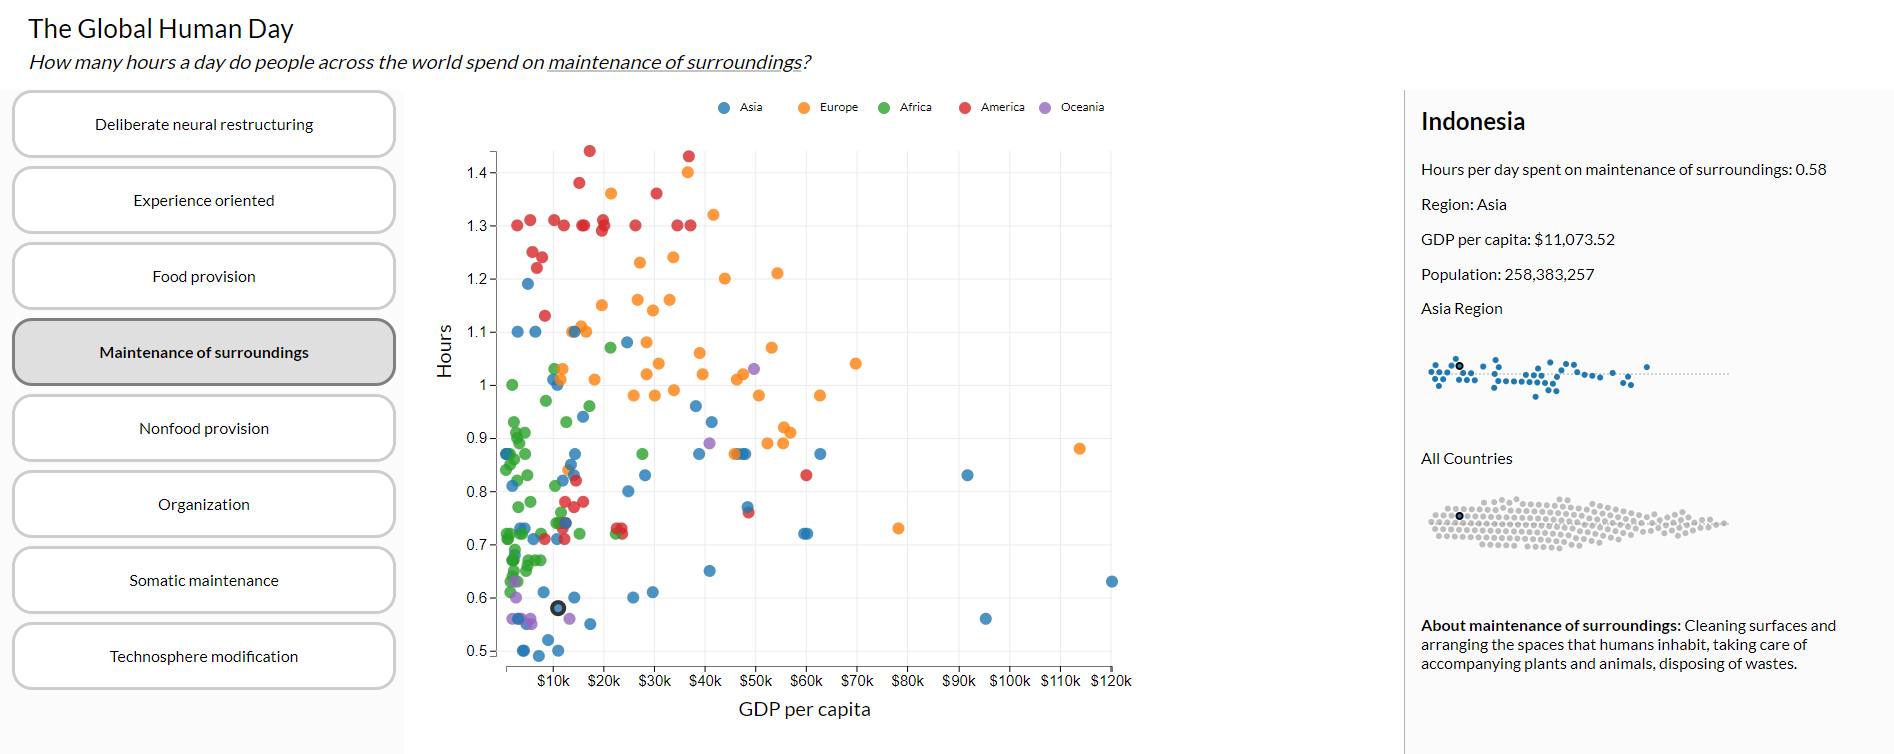
Global Human Day Interative Visualization
In a team of two, we created a interactive scatterplot visualization with filters, animations, and an expand-on-demand sidebar with contextual bubbleplots.
Project FeederWatch Data Analysis
I collaborated with a partner to visualize a dataset from Project FeederWatch, an extensive citizen-science-based project by Cornell's Lab of Orninthology, analyzing the avian species at birdfeeders across North America in the winter of 2020 through the spring of 2021.
Read the Final Report or check out the entire Github!

FloodNet Transparency Project
FloodNet, a community and government partnership that aims to better understand flooding in New York City, tasked our team with improving transparency and public education about the flood sensors located in their neighborhoods. Given New York City's past with government surveillance and police abuse, the main goal was to educate the public that the sensors are not cameras, but rather use sound waves to calculate rising floodwaters. We created a 3D animation and Web-AR prototype to be accessible via QR-code at select sensors in high-traffic areas to provide transparency about this technology.
I was responsible for the creation of the 3D models and textures in Blender, camera work within Blender, and scripting of the final animation.