Projects
Please note: Some older projects may no longer be available due to discontinued hosting services. Feel free to contact directly for inquiries about specific projects.
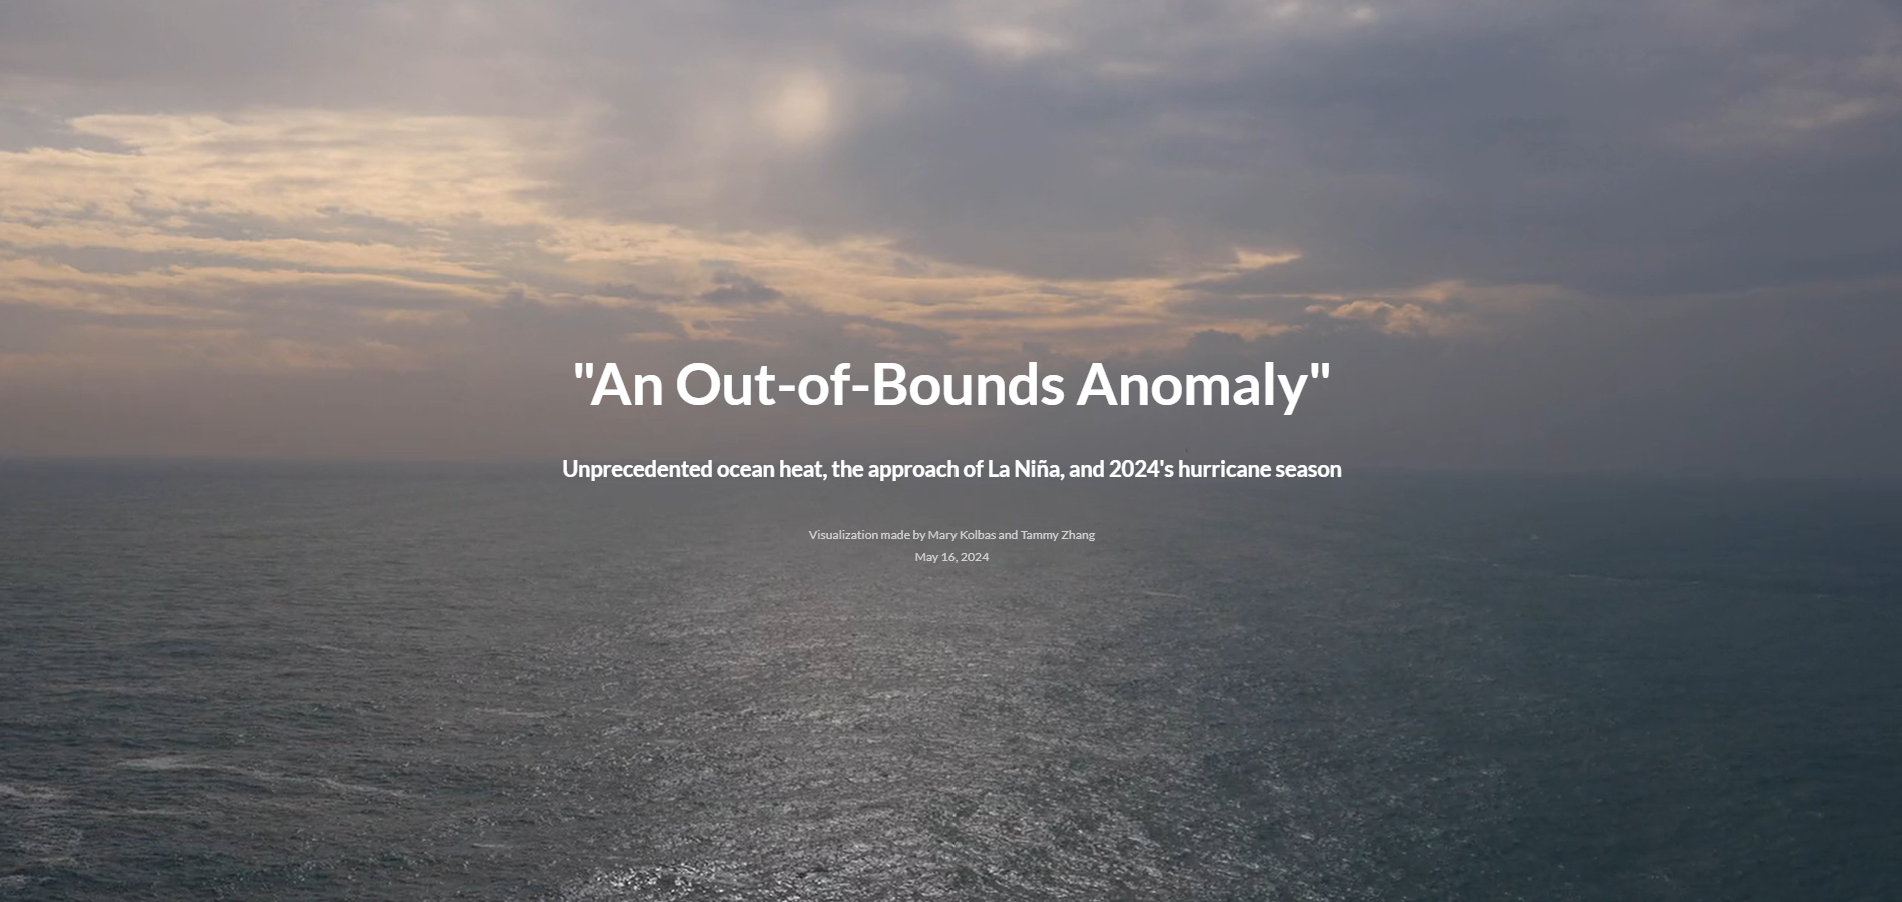
"An Out-of-Bounds Anomaly" - 2024 Hurricane Season Visualization
For our final project, my partner and I created a interactive scrollytelling article to inform readers about unprecedented rising ocean temperatures and the effects of La Niña on the 2024 hurricane season.
NCT Force: A visualization of K-Pop Group NCT's Discography Network
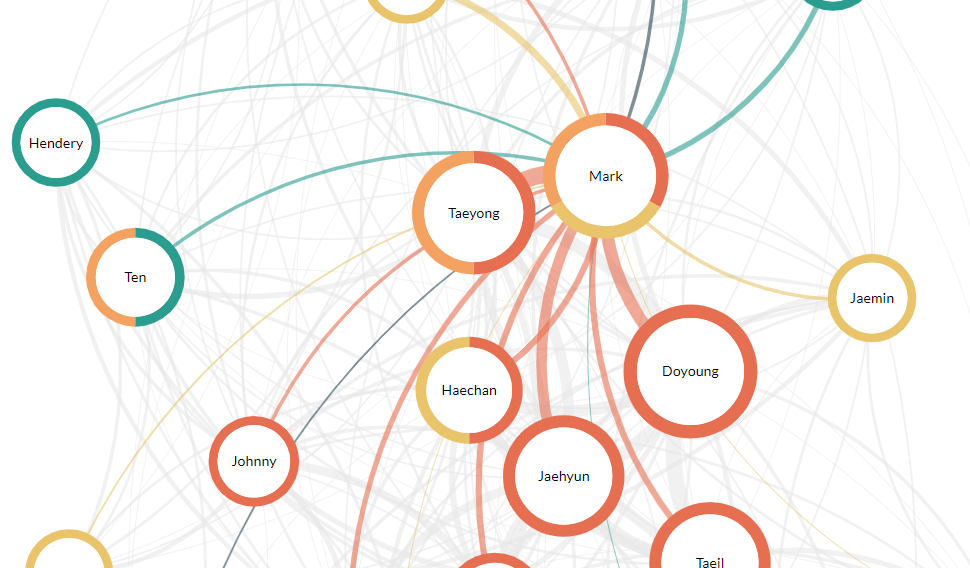
Combining my interests in networks, data visualization, and K-pop, my partner and I created a interactive force diagram data visualization of NCT's 23 members and which songs members have been on together using d3.js. Pan, zoom, hover, and click interactions allow users to explore relationships between members and expand for more information on demand.
This project is a design critique of a personal project from January 2023, NCT Chord.
NCT Force is not currently fit for mobile viewing. Please view on a larger screen.
Global Human Day Interative Visualization
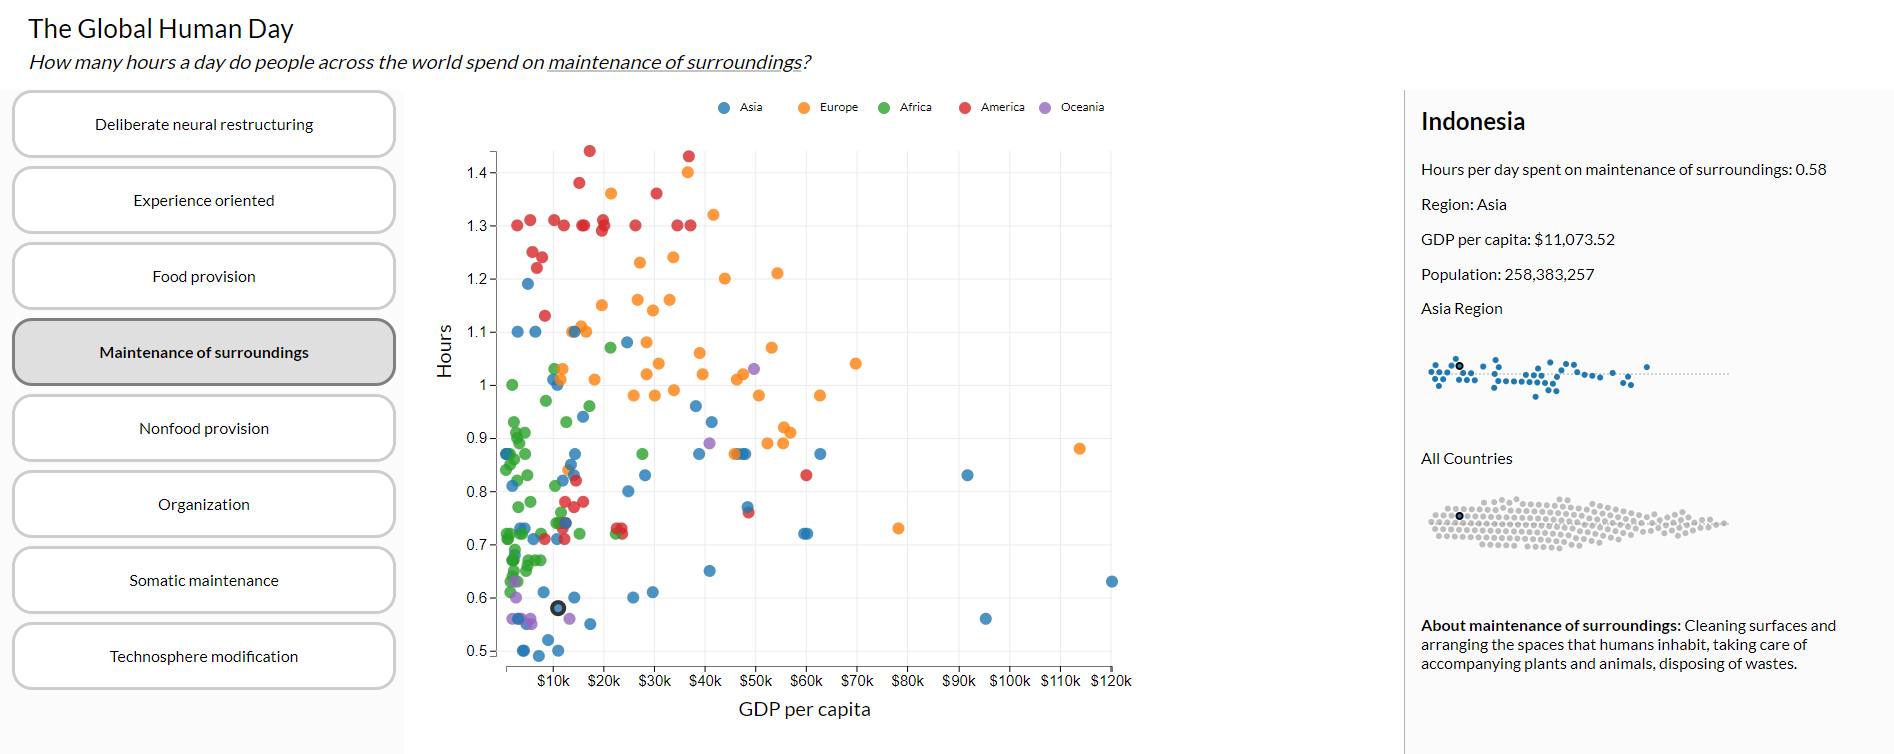
In a team of two, we created a interactive scatterplot visualization with filters, animations, and an expand-on-demand sidebar with contextual bubbleplots.
NCT Chord: A visualization of K-Pop Group NCT's Discography Network
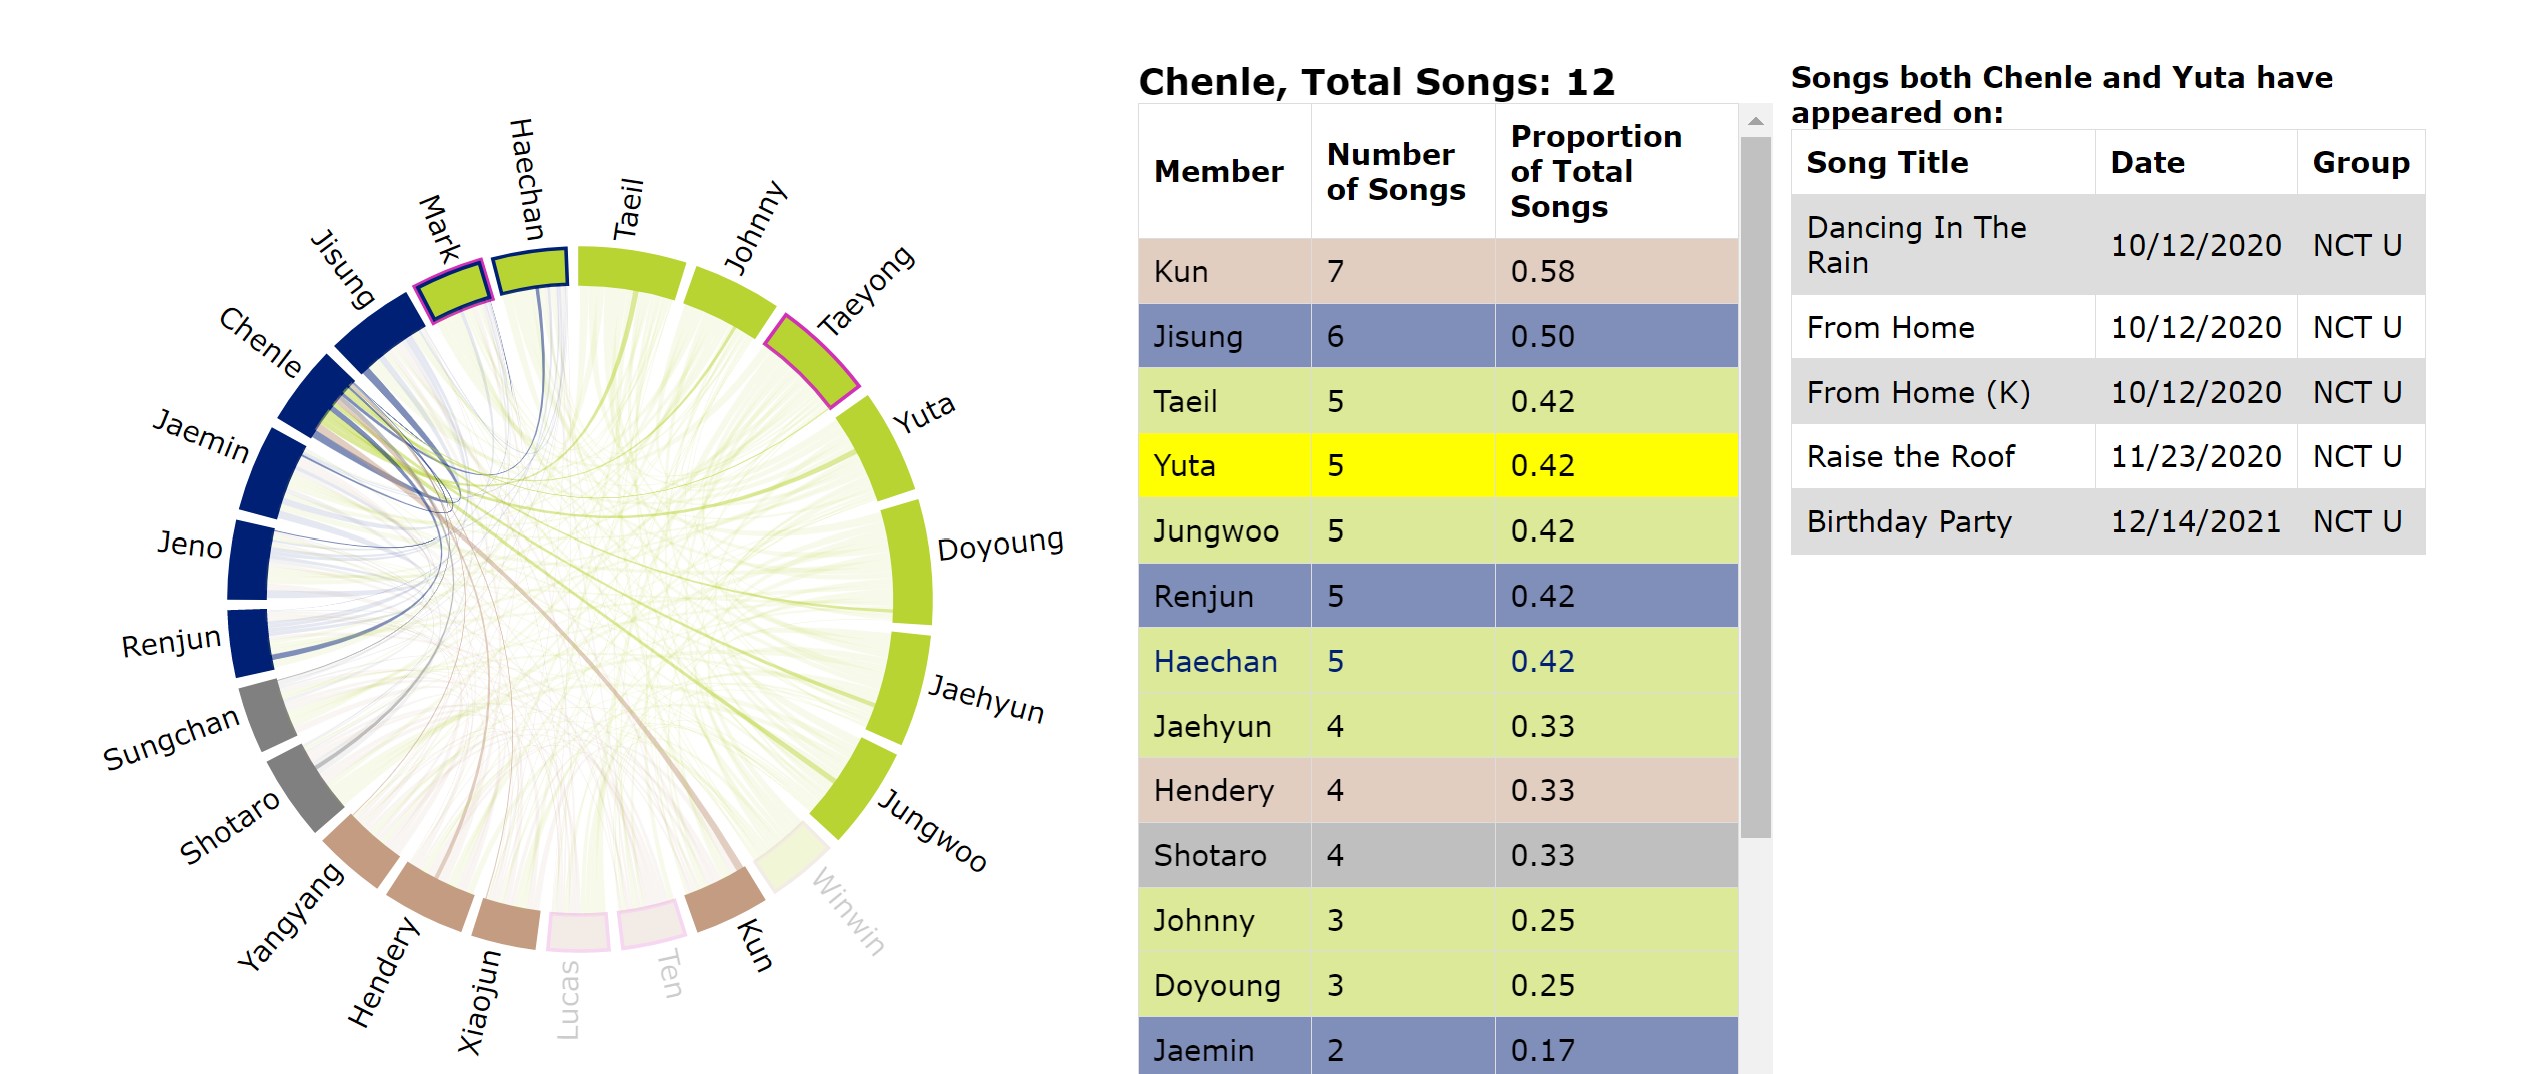
Combining my interests in networks, data visualization, and K-pop, I created a interactive chord diagram data visualization of NCT's 23 members and which songs members have been on together. Colors and filters help distinguish regularly promoting subgroups to one-time releases with unique combinations of members.
Please note that at this time NCT Chord is only fit for screen sizes larger than 1270px.
NCT Chord is not currently fit for mobile viewing. Please view on a larger screen.
Project FeederWatch Data Analysis
I collaborated with a partner to visualize a dataset from Project FeederWatch, an extensive citizen-science-based project by Cornell's Lab of Orninthology, analyzing the avian species at birdfeeders across North America in the winter of 2020 through the spring of 2021.
Read the Final Report or check out the entire Github!

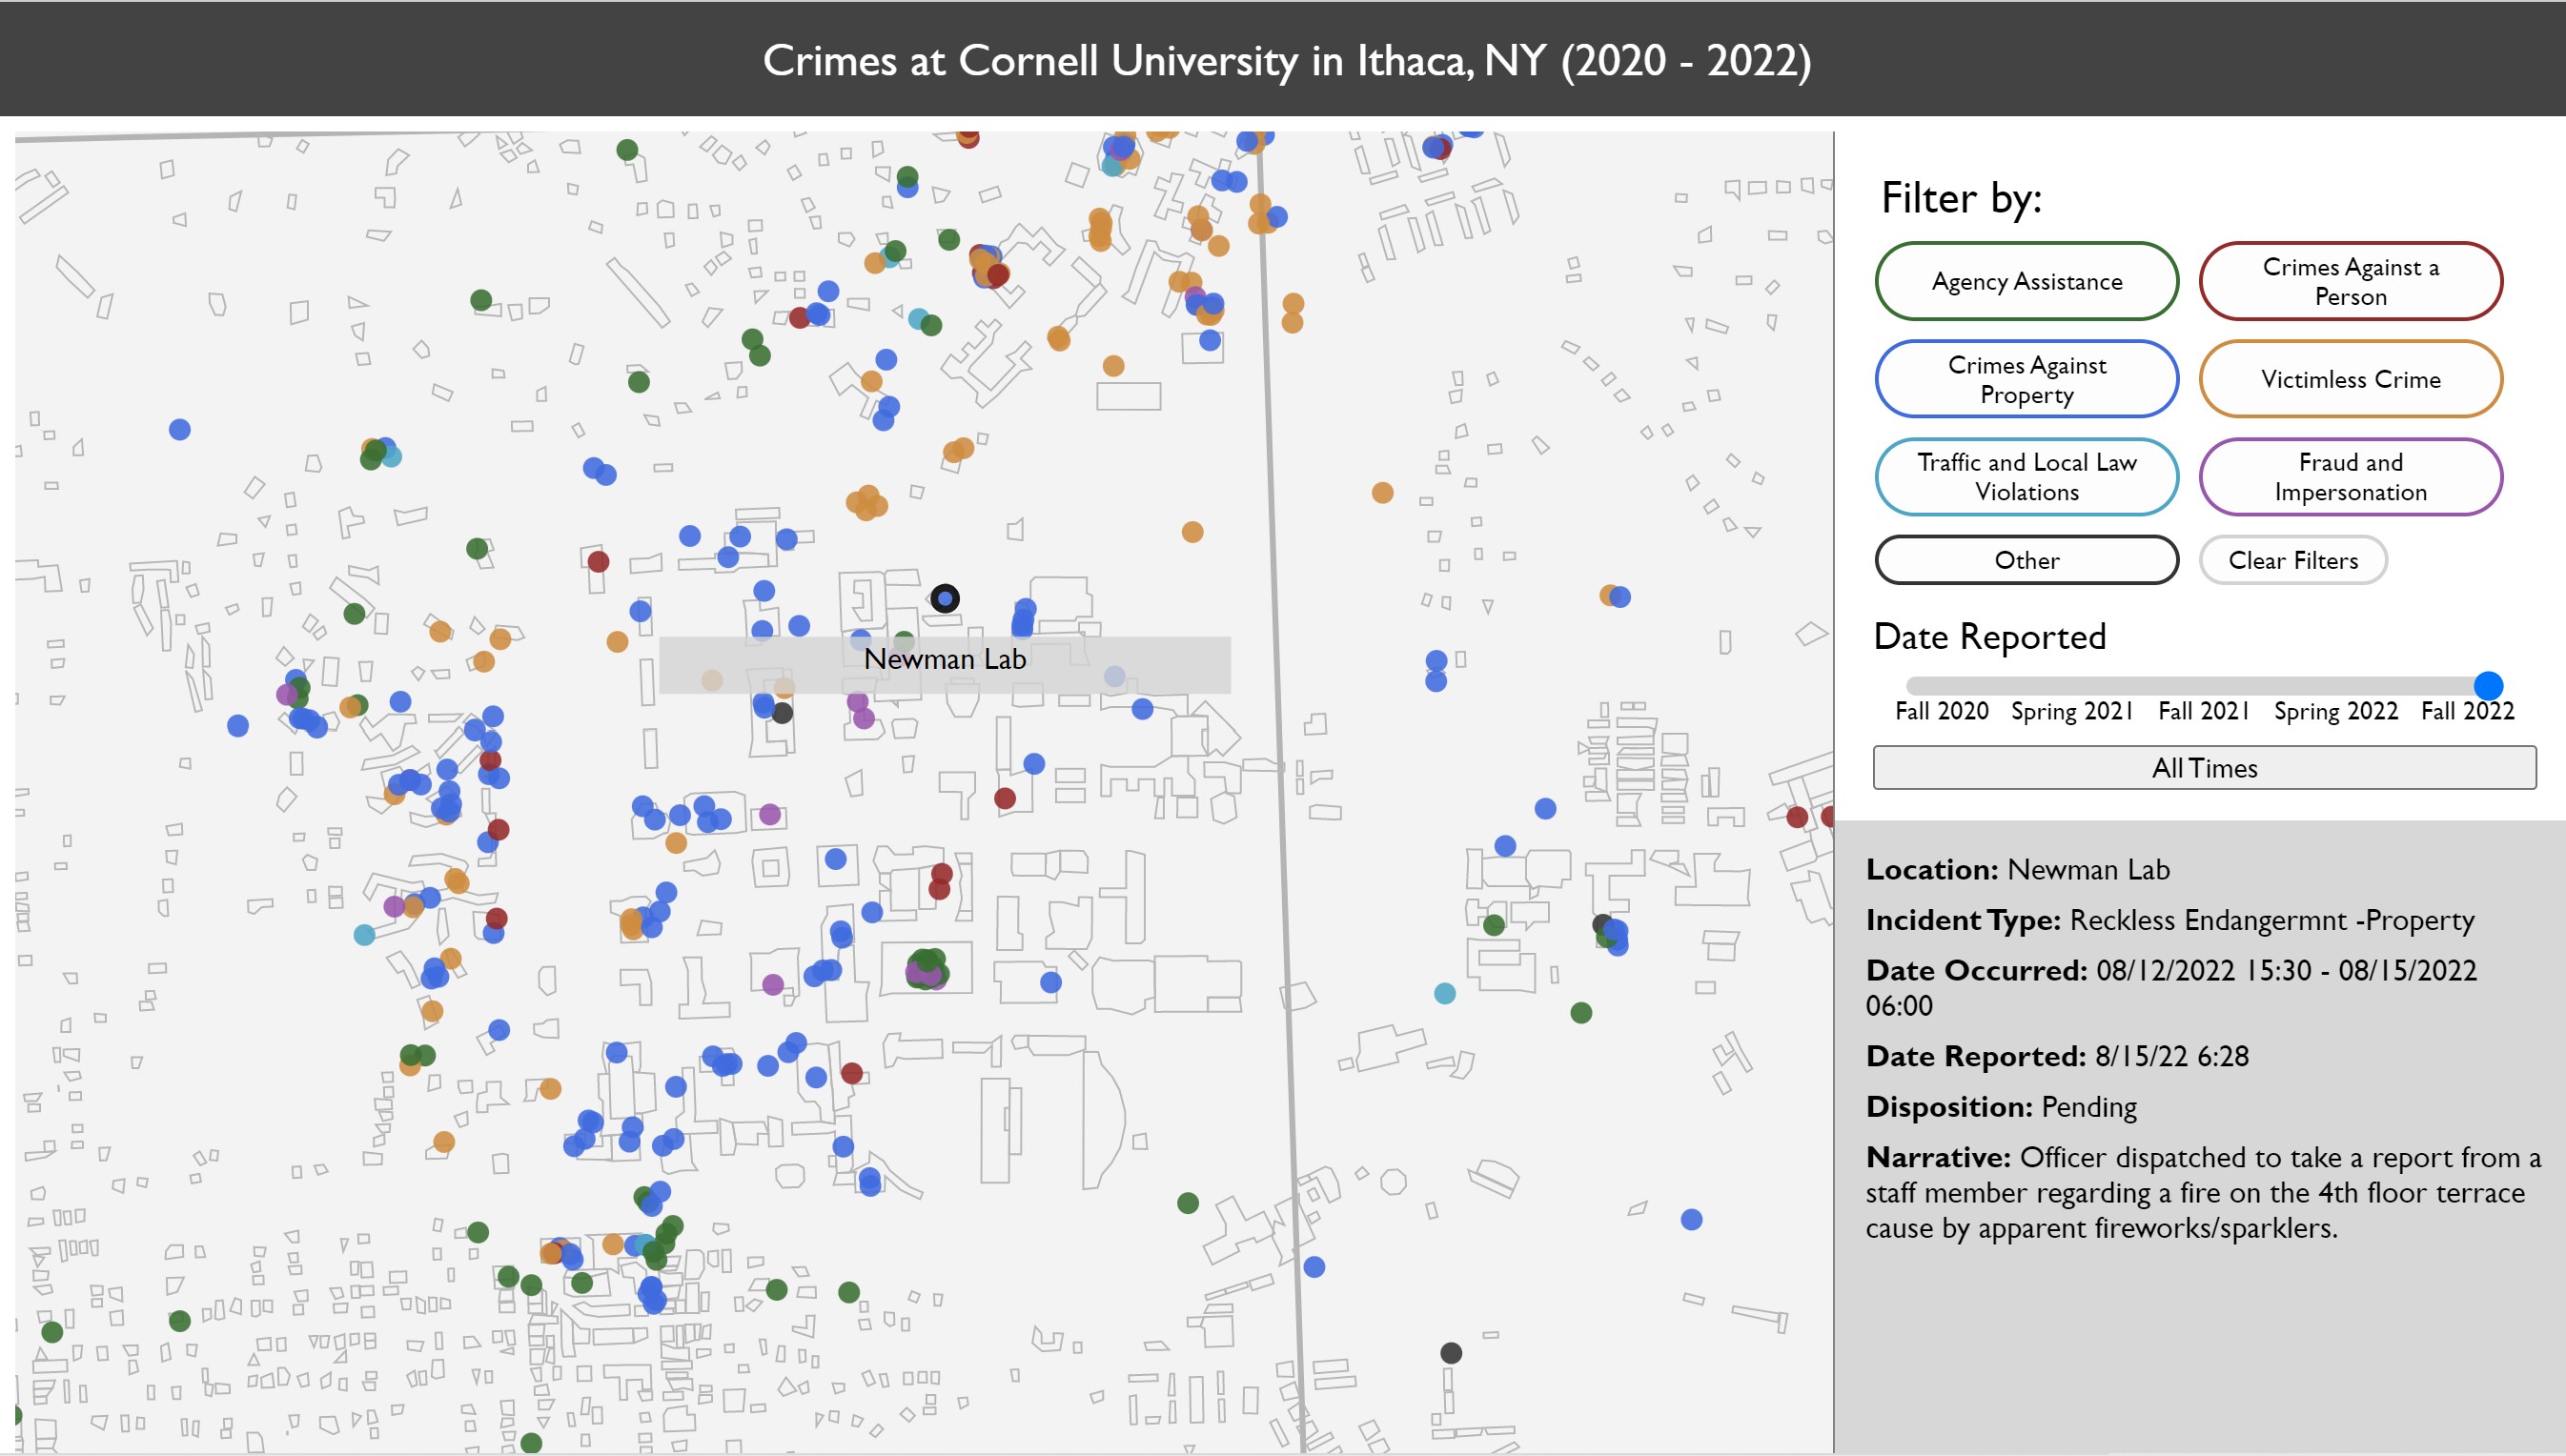
Interactive Data Visualization of Cornell Crime
I collaborated in a team of 4 to visualize data from the Cornell University Police Department (CUPD) daily crime logs through web scraping, processing in Jupyter Notebook, and designing and implementing an interactive visualization via JavaScript library D3.js with features such as pan/zoom, hover, filtering, and an interactive time slider.
Explore the Visualization or See the Code!
Read the Final Report for coding process and final analysis!
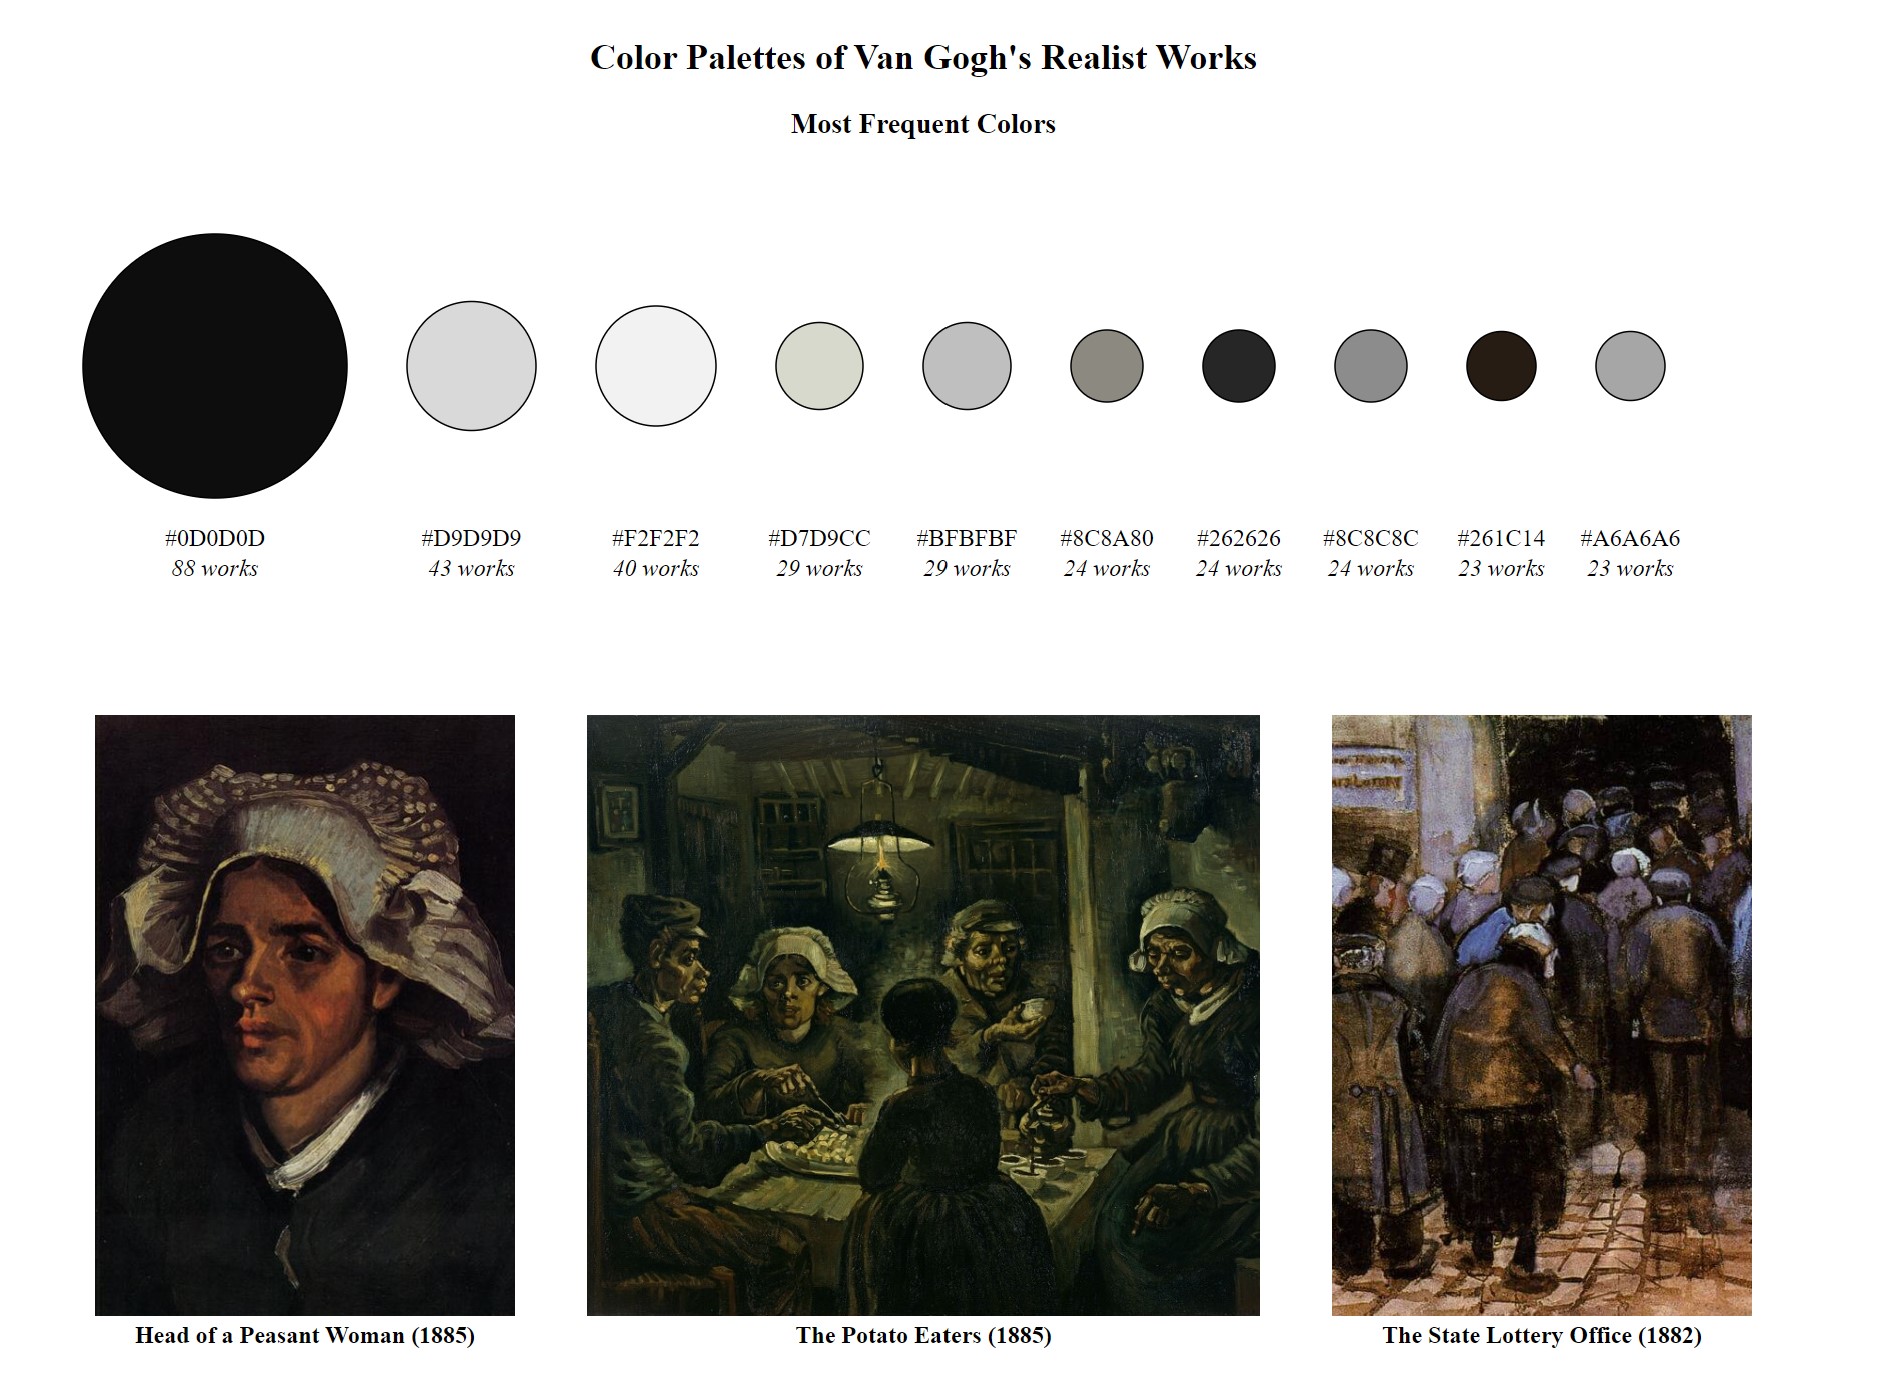
Data Visualization of Colors of Van Gogh
I collaborated in a team of 3 to process the Colors of Van Gogh dataset in Jupyter Notebook and visualize via JavaScript library D3.js.
Explore the Visualization or See the Code!
Read the Final Report for coding process and final analysis!
FloodNet Transparency Project
FloodNet, a community and government partnership that aims to better understand flooding in New York City, tasked our team with improving transparency and public education about the flood sensors located in their neighborhoods. Given New York City's past with government surveillance and police abuse, the main goal was to educate the public that the sensors are not cameras, but rather use sound waves to calculate rising floodwaters. We created a 3D animation and Web-AR prototype to be accessible via QR-code at select sensors in high-traffic areas to provide transparency about this technology.
I was responsible for the creation of the 3D models and textures in Blender, camera work within Blender, and scripting of the final animation.
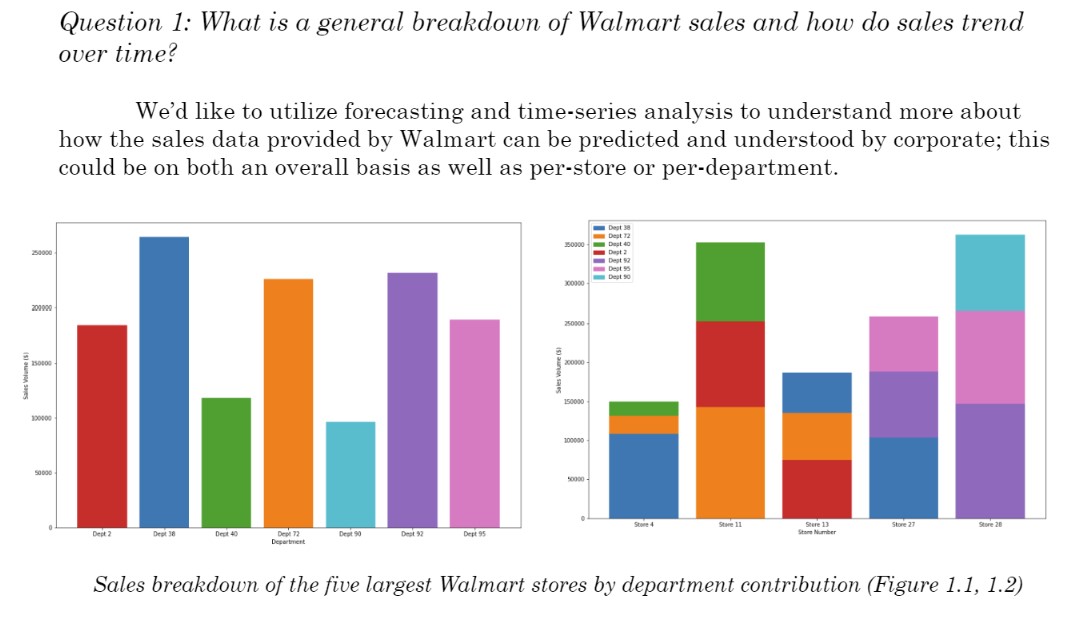
Walmart Historical Sales Data Analysis Project
I collaborated with a team of 4 to code, process, and analyze a anonymized historical Walmart Retail Sales dataset using Python (pandas) and SQL.
Playful Plants
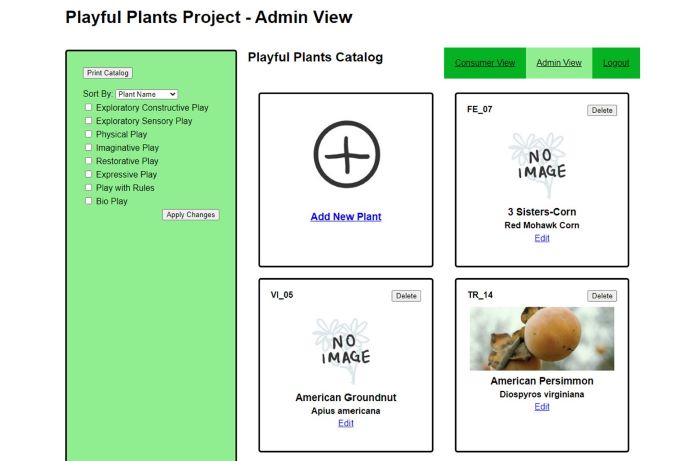
For the INFO 2300 final project, I created a website for The Playful Plants Project (client) from scratch in PHP. This dynamic, server-side rendered website queries a database using SQL and supports sticky forms, file uploads, functional login/logout, sessions and cookies, filtering and sorting, and adding, editing, and deleting entries in the database. This project involved multiple user personas including cognitive style facets, cognitive walkthroughs, sketch itterations, and more.
Login with the username "tim" and password "monkey" in order to access admin-only pages.
Staying Sane At Cornell: Introductory Classes
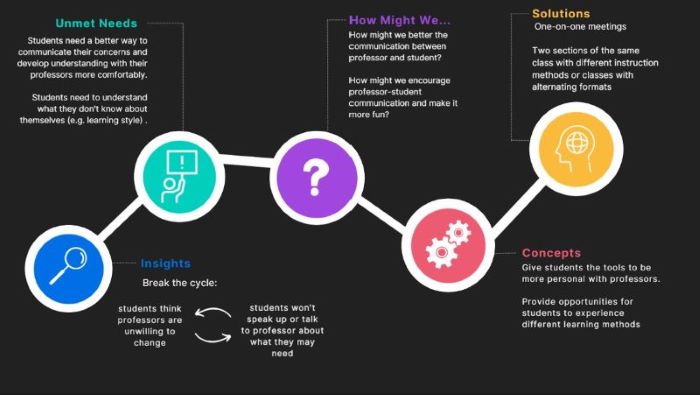
This semester long project was inspired by the prompt "Staying Sane At Cornell". My group of 5 focused on the stress surrounding introductory classes, especially due to their large class size, dense material, differences in student's background experience, and the disconnect between professors and students. This exploratory project involved ethnographic interviews, creating frameworks and prototypes, and multiple itterations.
We presented our findings to a panel of Cornell administrators, including the Cornell Vice Provost for Undergraduate Education.
疫情和我 (The Epidemic and I)
疫情和我 (The Epidemic and I), a short paper written in simplified Chinese, describes the changes in my life as a result of COVID-19. It focuses on the new technologies that have emerged and their impact in my everyday life for education, extra curriculars, and socializing with friends.